

Laptop displaying financial cash flow chart on desk with settlement documents calculator and coffee cup top-down view
How to Model Structured Settlement Payments for Financial Planning

Content
Think of structured settlement payment modeling as building a financial roadmap that shows exactly how your settlement money arrives month by month, year by year—then adjusting that picture for real-world forces like inflation eating away at purchasing power and tax obligations cutting into your actual take-home amounts.
Here's what sets a real model apart from those quick online calculators: A calculator spits out "$450,000" and calls it a day. Meanwhile, an actual projection model breaks down every single payment, shows you what $3,000 buys today versus fifteen years from now, and lets you test "what happens if I sell payments 60-84 to cover my daughter's college tuition?"
Why does this matter? Because that calculator's $450,000 figure doesn't tell you whether it survives a rising interest rate environment, doesn't show how your money loses 35% of its buying power over two decades, and can't answer whether liquidating seven years of payments ruins your retirement plan. Real decisions need better tools.
Different people need these models for different reasons. If you're receiving payments, you're planning around major life expenses—maybe a home purchase in year three, college costs in year twelve, or retirement supplementation starting year eighteen. Attorneys use projection models during negotiation to prove a structured offer actually delivers more value than a $600,000 lump sum when you account for investment risk and tax treatment. Financial advisors integrate them into broader wealth plans to coordinate settlement income with other assets. And factoring companies? They're running sophisticated versions to price secondary-market purchases down to the penny.
The real power emerges when you turn static settlement paperwork into a testing ground for financial decisions. Your 25-year payment schedule becomes something you can interrogate: "What if my healthcare costs spike in year ten? What if inflation runs at 4% instead of 2.5%? What if I absolutely need $75,000 in year six?" These questions determine whether you thrive financially or scramble constantly.
Core Variables That Drive Settlement Income Projections
Building reliable settlement income projections means knowing which factors actually change outcomes versus which ones just add complexity without value. Let's separate signal from noise.
Your payment schedule structure sits at the foundation—are you getting $2,000 every month for life, $50,000 lump sums every five years, or some combination? A 45-year-old receiving $3,500 monthly for 20 years faces completely different planning challenges than someone getting $100,000 every five years for the same period. The monthly recipient has steady cash flow but must manage smaller amounts; the lump-sum recipient gets liquidity bursts but needs serious discipline between payments.
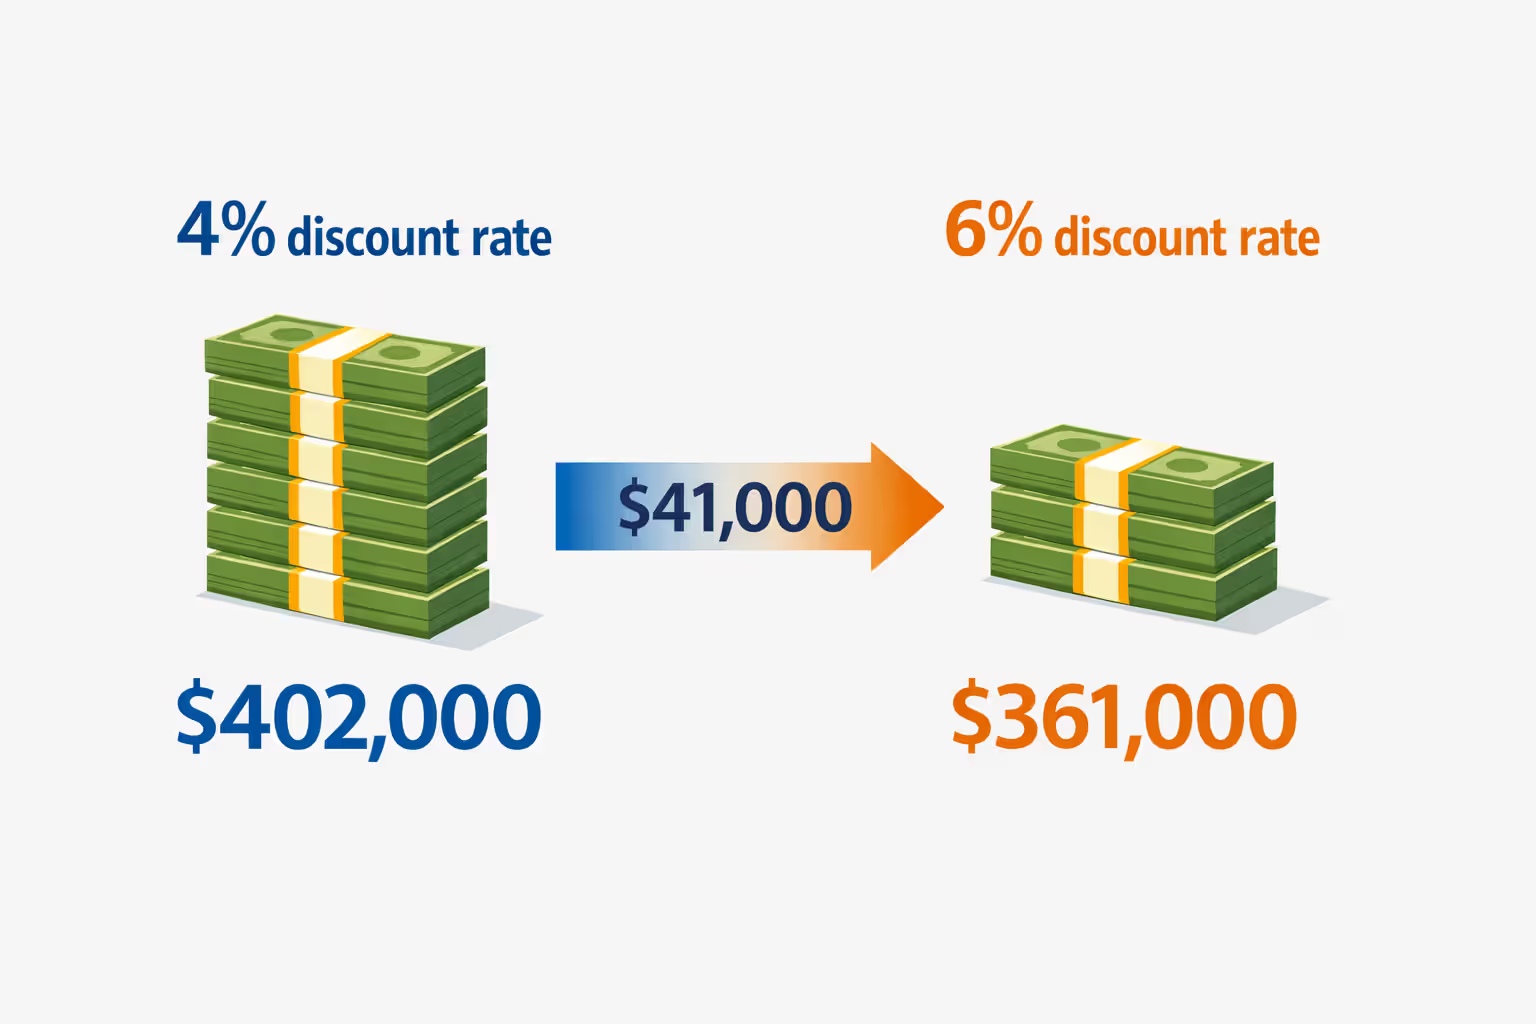
Present value calculations determine what all those future payments are worth right now. Say you're receiving $3,000 monthly for fifteen years—that's $540,000 in total nominal payments. But what's it actually worth today? Pick a 4% discount rate and you're looking at roughly $402,000. Bump that to 6% and you drop to $361,000. That's a $41,000 swing just from changing one assumption. Most financial professionals anchor to Treasury yields matching your payment timeframe, then add one to two percentage points for illiquidity and risk, but there's honest disagreement about what rate fits personal planning versus institutional valuation.
Author: Danielle Morgan;
Source: avayabcm.com
Life expectancy matters enormously for lifetime payment structures. A 45-year-old woman receiving guaranteed lifetime payments needs actuarial mortality tables showing survival probabilities at each future age. The standard tables give you baseline odds, but your specific health situation might look nothing like the average. Family history of longevity? Chronic health condition? These factors shift expectations materially. And if your settlement includes survivor benefits for a spouse, you're now modeling joint life expectancies—much more complex probability math.
Tax treatment creates massive value differences depending on your settlement's origin. Personal injury settlements typically flow tax-free under IRS rules, while employment-related settlements and punitive damages get taxed as ordinary income. A $4,000 monthly tax-free payment delivers the same spending power as roughly $5,300 taxable income for someone in the 25% federal bracket. Models that skip this distinction might as well be random number generators.
Inflation slowly destroys purchasing power on fixed payments. That $3,000 monthly payment buys dramatically different amounts in year one versus year twenty. Run 3% annual inflation and by year twenty, your payment only buys what $1,660 bought initially—you're losing 45% of your real purchasing power. A few structured settlements include cost-of-living adjustments, but most don't. Your model absolutely must account for this erosion explicitly, or you're planning in fantasy land.
Variables That Determine Settlement Projection Outcomes
| Input Factor | What It Represents | Common Values | How It Changes Your Bottom Line |
| Discount Rate | The annual percentage used for calculating what future money is worth now | Ranges from 3% to 7% depending on Treasury rates plus risk adjustment | Each 1% increase typically cuts present value by 8-12% for settlements lasting 20 years |
| Payment Timing | The intervals between receiving money | Could be monthly deposits, quarterly checks, annual payments, or scheduled lump sums | More frequent payments add slight value because you can use money sooner |
| Inflation Factor | How much purchasing power erodes annually | Historical US average hovers around 3%, though recent years have seen 2-4% | Fixed payments lose 40-55% of real buying power across 20 years at typical inflation rates |
| Tax Treatment | Whether the government takes a cut | Personal injury settlements are usually tax-free; employment and punitive settlements get taxed | Tax-exempt status effectively increases value by 20-40% depending on your tax bracket |
| Longevity | How many years payments continue for lifetime structures | Depends on actuarial life tables adjusted for personal health factors | Living longer increases total dollars received but spreads value across more years |
| COLA Language | Automatic payment increases built into the settlement | Either zero (no increases), or 2-3% annual bumps | A 3% COLA can boost total value by 30-50% over settlements lasting 20+ years |
Step-by-Step Process for Building a Settlement Payment Forecast Model
First step: dig out your complete settlement agreement and read it carefully. You need exact payment dates, precise dollar amounts, and any conditional language about adjustments or contingencies. Look specifically for cost-of-living clauses, survivor benefit provisions, guaranteed minimum periods, and life contingency terms. Missing a detail here creates errors that compound throughout your entire model. I've seen people miss a single line about "payments beginning the first business day following January 15, 2024" and end up with their entire present value calculation off by three weeks of discounting.
For your modeling platform, Excel or Google Sheets handles most individual situations just fine. Set up columns for payment date, payment amount, your discount factor, and present value. For straightforward monthly payments, you're calculating PV = Payment / (1 + r)^n, where r equals your periodic discount rate and n represents the number of periods. More complicated structures with multiple payment streams need separate calculation rows for each component, then you sum everything.
Entering payment schedules requires precision. Here's a mistake I see constantly: people use 12 as the period count per year when payments actually arrive on specific calendar dates each month. If payments start January 15th and you're discounting back to January 1st, that first payment sits 14 days away, not zero days. Over long timeframes, these small timing errors stack up. Use actual date functions instead of assuming every month contains identical days.

Author: Danielle Morgan;
Source: avayabcm.com
Converting discount rates for present value work means matching your rate to your payment frequency. A 5% annual rate doesn't just divide by 12 for monthly payments—you need (1.05)^(1/12) - 1, which gives you approximately 0.4074% monthly. That monthly rate then discounts each payment individually. By the 60th payment, your discount factor becomes 1/(1.004074)^60, roughly 0.7835, meaning that payment is worth 78.35 cents per dollar in today's money.
Scenario testing transforms your single estimate into a decision framework. Build three complete versions: conservative (higher discount rate, lower inflation, shorter life expectancy), baseline (middle-ground assumptions), and optimistic (lower discount rate, higher inflation, longer life expectancy). The spread between scenarios reveals your uncertainty zone. If present value ranges from $380,000 to $485,000 depending on which assumptions you pick, you're looking at meaningful uncertainty that should shape how you make decisions.
Common Mistakes That Undermine Model Accuracy
Picking the wrong discount rate causes more problems than any other error. Using a savings account rate around 1-2% massively overstates present value because it completely ignores the illiquidity and credit risk inherent in a 20-year payment obligation. On the flip side, using personal borrowing rates like credit card APRs (15%+) because "that's what money costs me" understates value by confusing your personal creditworthiness with the settlement's actual risk profile. Instead, match your rate to comparable-duration, comparable-risk instruments—usually investment-grade corporate bonds or Treasury securities plus a modest premium.
Skipping tax implications creates fantasy projections. I've watched recipients model $500,000 in future employment settlement payments without accounting for the 30% tax bite, then express shock when their actual spendable cash falls dramatically short. Create separate rows showing gross payment, estimated tax withholding (using your actual marginal federal and state rates), and net payment. Your spending plans should use net figures exclusively, not the gross numbers.
Mishandling cost-of-living adjustments happens in both directions. Some models assume COLA provisions that don't actually exist in the settlement agreement, artificially inflating long-term value projections. Others completely ignore explicit COLA language that's right there in the contract, understating value. Read your actual agreement word-for-word and model exactly what's written, not what you assumed or hoped would be there.
Relying on outdated mortality tables introduces systematic error into lifetime payment valuations. The Social Security Administration updates life expectancy tables regularly as medical advances extend longevity. Tables from 2010 understate current life expectancies by one to two years—a material difference when you're projecting 30+ years of payments. Download current tables and adjust for personal health factors, ideally with professional guidance from someone who understands actuarial analysis.
Professional Tools and Software for Structured Settlement Forecasting
Excel-based templates work perfectly well for most individual settlement recipients. You can build a functional projection model in an afternoon if you're comfortable with basic spreadsheet formulas. Set up your payment schedule, discount rate assumptions, and present value calculations in a clear, verifiable format where someone else could review your work and understand your logic. The upside: complete transparency and total customization to your specific situation. The downside: you're personally responsible for formula accuracy and need to actually understand the underlying financial math.
Dedicated financial modeling platforms—think specialized structured settlement software or proprietary actuarial tools—offer sophisticated capabilities like automatic mortality table integration, Monte Carlo simulations for uncertainty analysis, and tax optimization algorithms that adjust strategies dynamically. These platforms typically cost several hundred to several thousand dollars annually. They excel at handling complex scenarios: multiple contingent beneficiaries, variable interest rate environments across different economic projections, and integrated tax planning across federal and state jurisdictions. Worth the cost if you're dealing with truly complicated settlements, but overkill if you're receiving straightforward monthly payments.
Industry-standard actuarial software like Prophet or MG-ALFA represents the professional tier that insurance companies and large factoring firms use internally. These systems model entire portfolios containing hundreds or thousands of structured settlements with sophisticated risk analytics, regulatory compliance features, and institutional-grade validation. Unless you're managing an institutional settlement portfolio, these tools cost too much and require specialized training that takes months to develop. Individual recipients should ignore this tier entirely.
Online calculators provide quick ballpark estimates but rarely qualify as comprehensive forecasting guides. Most use simplified assumptions and hide their methodology. They're useful for rough magnitude checks—"Is my settlement in the $300,000 ballpark or the $500,000 ballpark?"—but shouldn't drive significant decisions. That free calculator giving you a single number with zero detail about discount rates, tax treatment, or underlying assumptions delivers exactly what you paid for it: an educated guess.
Deciding between hiring a financial professional versus building your own model depends on complexity and stakes. Receiving $2,500 monthly for 10 years with zero contingencies or special provisions? A well-constructed Excel model should serve you fine. Dealing with lifetime payments including survivor benefits, multiple scheduled lump sums, and considering selling a portion of future payments? Hire a Certified Financial Planner with demonstrated structured settlement experience. Paying a few hundred dollars in consulting fees prevents five-figure mistakes from faulty assumptions or modeling errors.
How to Interpret and Use Your Settlement Projection Results
Visualizing cash flow timelines and cumulative value charts reveals patterns invisible in raw spreadsheet numbers. Create a line graph showing monthly payments across your entire settlement duration. Does your cash flow hold steady, increase gradually with cost-of-living adjustments, or spike periodically with scheduled lump sums? Add a second line tracking cumulative payments received over time. Watching where that cumulative line crosses major thresholds—$100,000, $250,000, $500,000—helps you visualize significant financial milestones and coordinate major expenses accordingly.
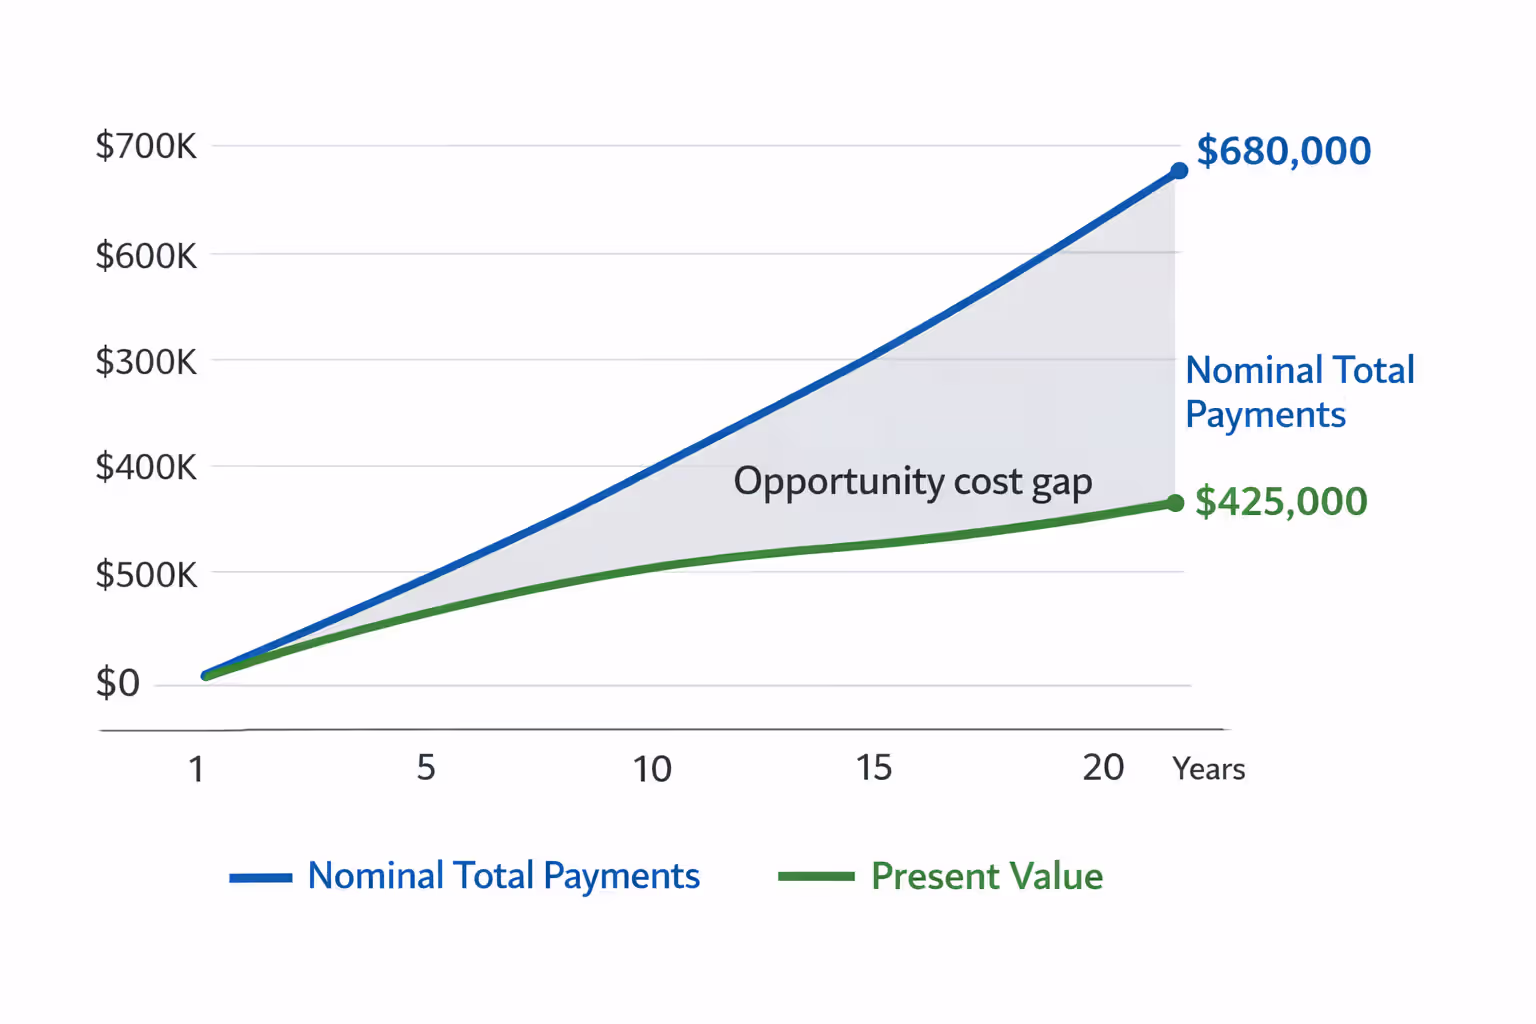
Comparing present value against total future payments highlights the time-value tradeoff embedded in your settlement. Your agreement might deliver $680,000 in nominal payments spread across 25 years, but present value calculated at a 5% discount rate shows $425,000. That $255,000 gap isn't accounting fiction—it represents the genuine opportunity cost of receiving money slowly rather than immediately investing it. But here's the catch: this comparison only matters if you'd actually maintain the discipline and investment skill to earn that 5% return consistently. For many recipients, guaranteed payments beat theoretical investment returns that never materialize because of poor execution.
Author: Danielle Morgan;
Source: avayabcm.com
Making informed decisions about selling payment rights requires comparing your model's present value against actual buyer offers. Factoring companies typically offer somewhere between 60-85% of present value calculated using conservative discount rates. If your model shows $400,000 present value at 5% and you receive a $280,000 offer, that's 70%—within normal market range but definitely worth shopping around for better terms. Offers below 60% of your calculated present value deserve serious skepticism unless you're using unusually aggressive (meaning low) discount rate assumptions that overstate value.
Using models during negotiations or legal proceedings adds substantial credibility when you can demonstrate your methodology transparently. Opposing counsel claims your settlement is worth $350,000; your detailed model demonstrates $475,000 using market-standard assumptions. The comprehensive spreadsheet showing every individual payment, each discount calculation, and all assumptions makes your position defensible under scrutiny. Courts and mediators respect transparent financial analysis backed by verifiable math over unsupported assertions or gut feelings.
The most common mistake I encounter is recipients building models that confirm what they want to believe rather than showing what the numbers actually demonstrate. A properly constructed structured settlement projection model should make you slightly uncomfortable—it forces direct confrontation with genuine tradeoffs between present liquidity and future financial security. When clients present me with models using 2% discount rates because 'that matches my savings account,' I know we need serious recalibration of expectations. Use actual market rates, adopt conservative assumptions that match real-world conditions, and then make decisions grounded in financial reality rather than wishful thinking.
— Jennifer Martinez
FAQ: Structured Settlement Payment Modeling
Structured settlement payment modeling converts abstract payment schedules into practical planning tools that reveal the genuine value and real-world implications of your settlement across its entire duration. The gap between a rough estimate and a detailed projection model frequently means thousands of dollars in superior decisions—whether you're evaluating a factoring company's purchase offer, planning major life expenses, or simply understanding what your settlement actually delivers after inflation and taxes take their cut.
The modeling process itself isn't particularly mysterious or complex. Gather your settlement documentation, choose appropriate discount rates reflecting current market realities, account for tax treatment specific to your settlement's origin, and build multiple scenarios testing how different assumptions affect outcomes. Whether you build Excel templates yourself or work with a financial professional, the goal stays consistent: replace vague uncertainty with quantified projections supporting confident decision-making.
Your settlement frequently represents the most significant financial asset you'll ever receive. Modeling that asset with the same analytical rigor you'd apply to evaluating real estate investments or stock portfolios isn't optional luxury—it's fundamental financial responsibility. The few hours invested in building or commissioning a proper structured settlement projection model pays dividends repeatedly every time you face a financial decision across the coming decades.